Projects
At the beginning of the summer of 2022 I was recruited to work on the the OCESE project through UBC's worklearn program for a 4 month period, and later on for a subsequent 8 month period. The project aimed to develop open-source computational tools and enhance the quantitative and computational capabilities of Earth Science students.
As part of this goal, the project developed dashboards to build and incorporate interactive apps for learning or demonstrations, which are planned to be used in 10 courses. Five of these courses use dashboards in assignments while others use them for demonstrations or optional enrichment resources. A total of fifteen apps were designed and built, with eleven being live for public access. A significant part of this initiative was the learning about the techniques for designing, building, deploying, and teaching with dashboards.
I had the luxury of developing several of the dashboards, which are being used in courses today by hundreds of students. The dashboards were developed, and upgraded based on both instructor and student feedback. Plotly Dash was used as the main framework for building the dashboards. AWS, Heroku, and Render were used for perliminary hosting of the dashboards during testing phases. Some of the dashboards I am proud of:
- EOSC 372 - A tool to rapidly view and compare selected data sets
- Sketch-annotation app - A dashboard that explores the capability of Plotly to act as a annotation tool. The code and insights from this project helped develop further dashboards in this project. Note: This dashboard is hosted on Render's free tier and may take 1-2 minutes to load on the first try.
- EOSC 362 labs 1, and 3 - Sketching tool for fossil record class based on my work on the sketch-annoation app. Note: runs on render
At the beginning of the summer of 2022 I was recruited to work on the the OCESE project through UBC's worklearn program for a 4 month period, and later on for a subsequent 8 month period. The project aimed to develop open-source computational tools and enhance the quantitative and computational capabilities of Earth Science students.
One ascpect of achieving this goal was an initiative to integrate Python programming and Jupyter Notebooks into student learning. Many of the created resources will eventualy be made available as Open Source Resources (OERs) and pedagogies, further contributing to the global educational community.
Throughout my time working on this project I had on oppurtinty to work on three main projects:
- DSCI 100 - The introductory data science course at UBC taken by 2000 students a year. My role in the project was to translate existing lecture and tutorial slides from the origanl R based to curriculum to the new Python curriculum. As well i was tasked with testing the notebooks developed for this course.
- EOSC 442 - A 4th year Climate Measurement and Analysis course. I was incharge of translating all the labs from Matlab to Jupyter notbeooks useing Python. The labs focused on data science centric ideas.
- EOSC 471 - A 4th year Waves, Currents and Ocean Mixing course. I was incharge of translating all the labs from Matlab to Jupyter notbeooks useing Python. The translation involved building many complex visualizations to aid students in visualizing oceanogrphic phonomena.
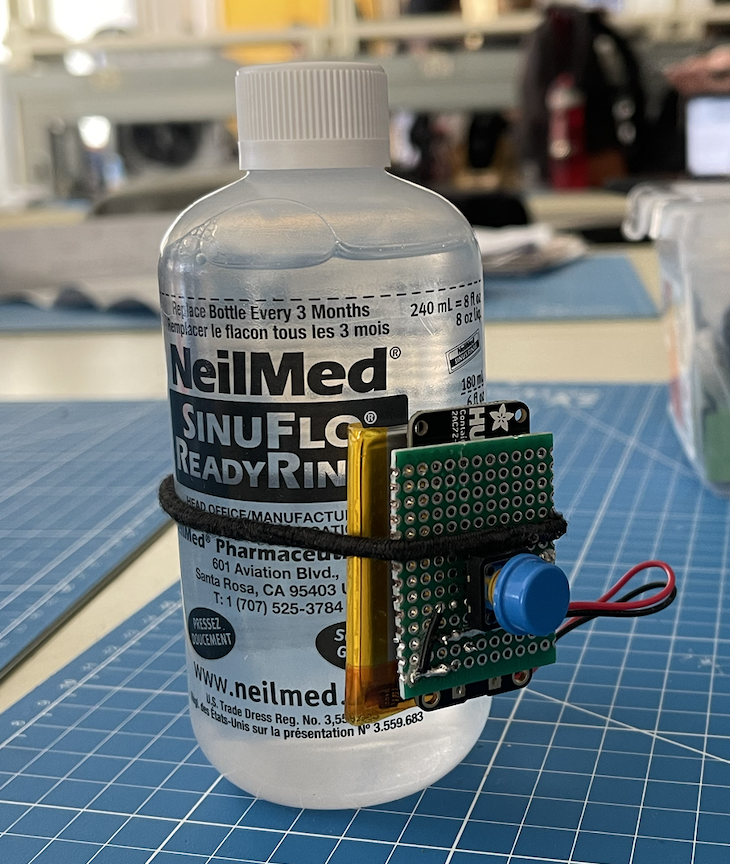
This project was presented by Dr. Andrew Thamboo at St. Paul’s Sinus Centre in British Columbia during my studies, and focused on addressing patient noncompliance with post-operative treatment for chronic sinus disease.
The final design concept involved both hardware and software components. The hardware included a button attached to the sinus rinse bottle, soldered onto a microcontroller. This board communicated via Bluetooth with the users' phones, enabling data logging, encryption, and trend visualization on an app and web based dashboard.
Project Gallery:
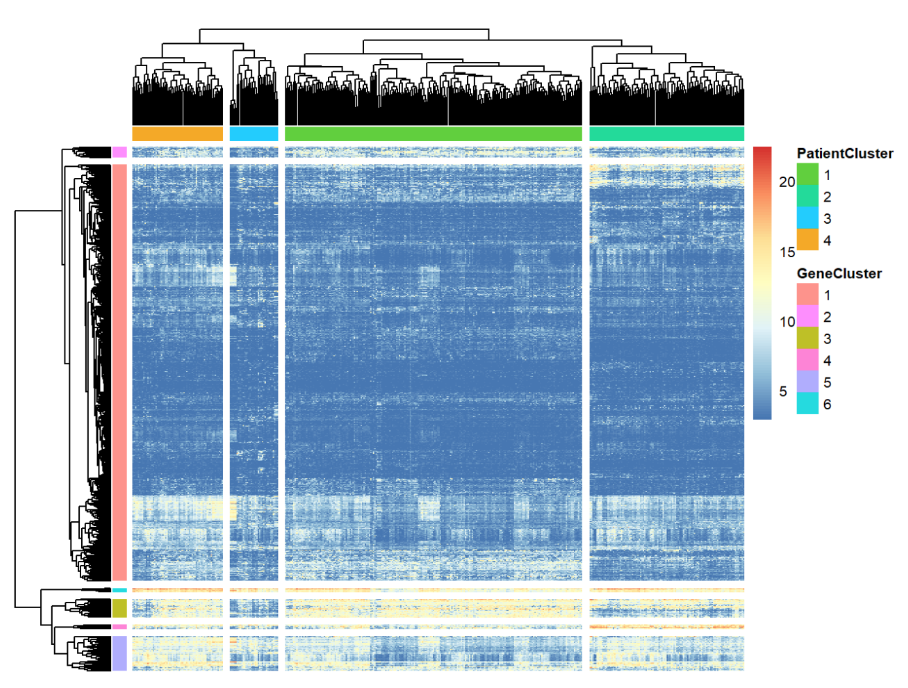
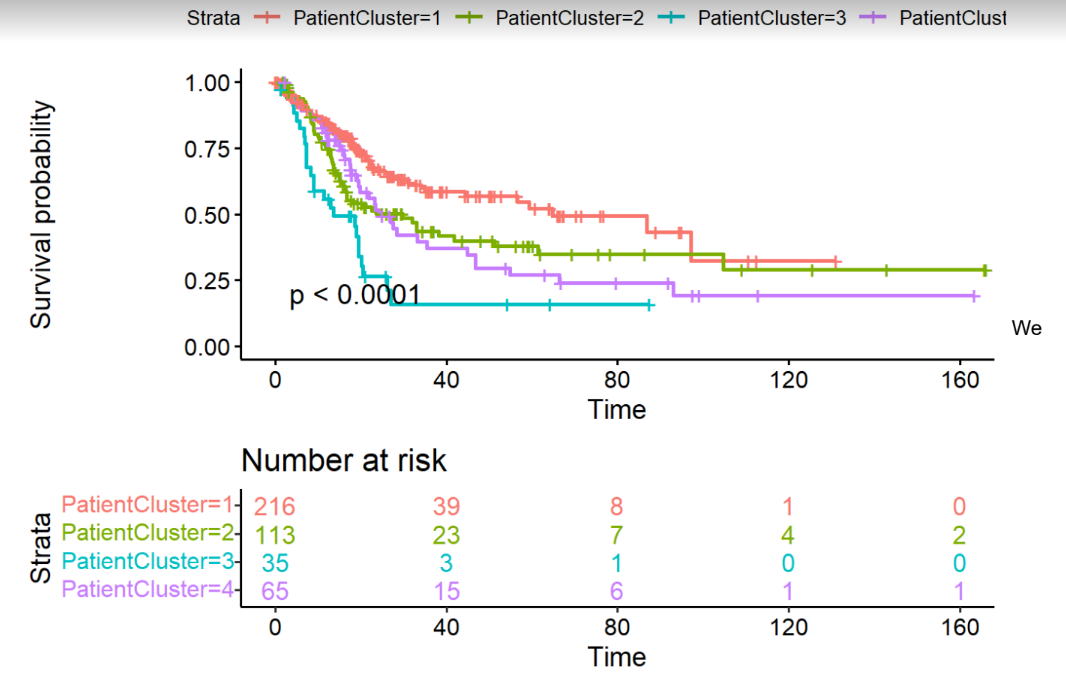
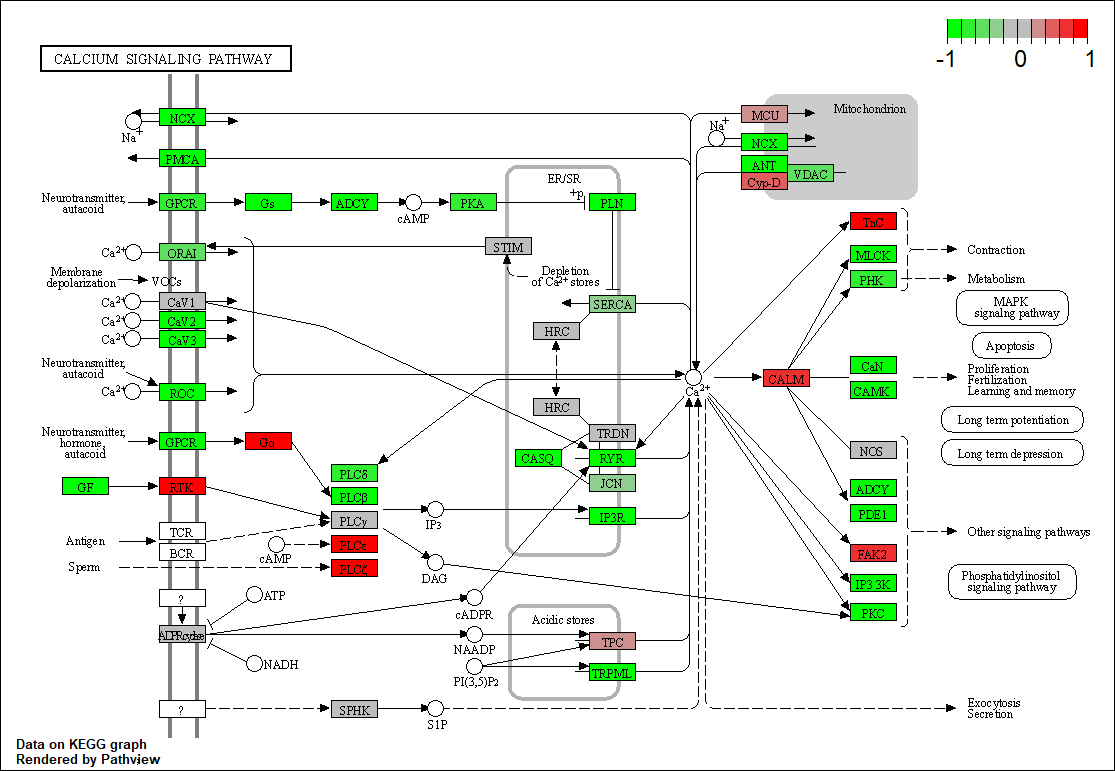
This project was presented in my introduction to bioinformatics course at university. Various bioinformatics methods were employed to identify biological trends and potential relationships between gene expressions, mutations, and patient demographics. The study utilized the Cancer Genome Atlas (TCGA) dataset for bladder cancer, examining 431 patients.
Through differential expression and pathway analyses, significant insights into gene expressions and mutations were obtained, leading to the identification of potential diagnostic markers and biological pathways relevant to the disease. The project's findings provide a strong foundation for understanding bladder cancer.
Project Gallery:
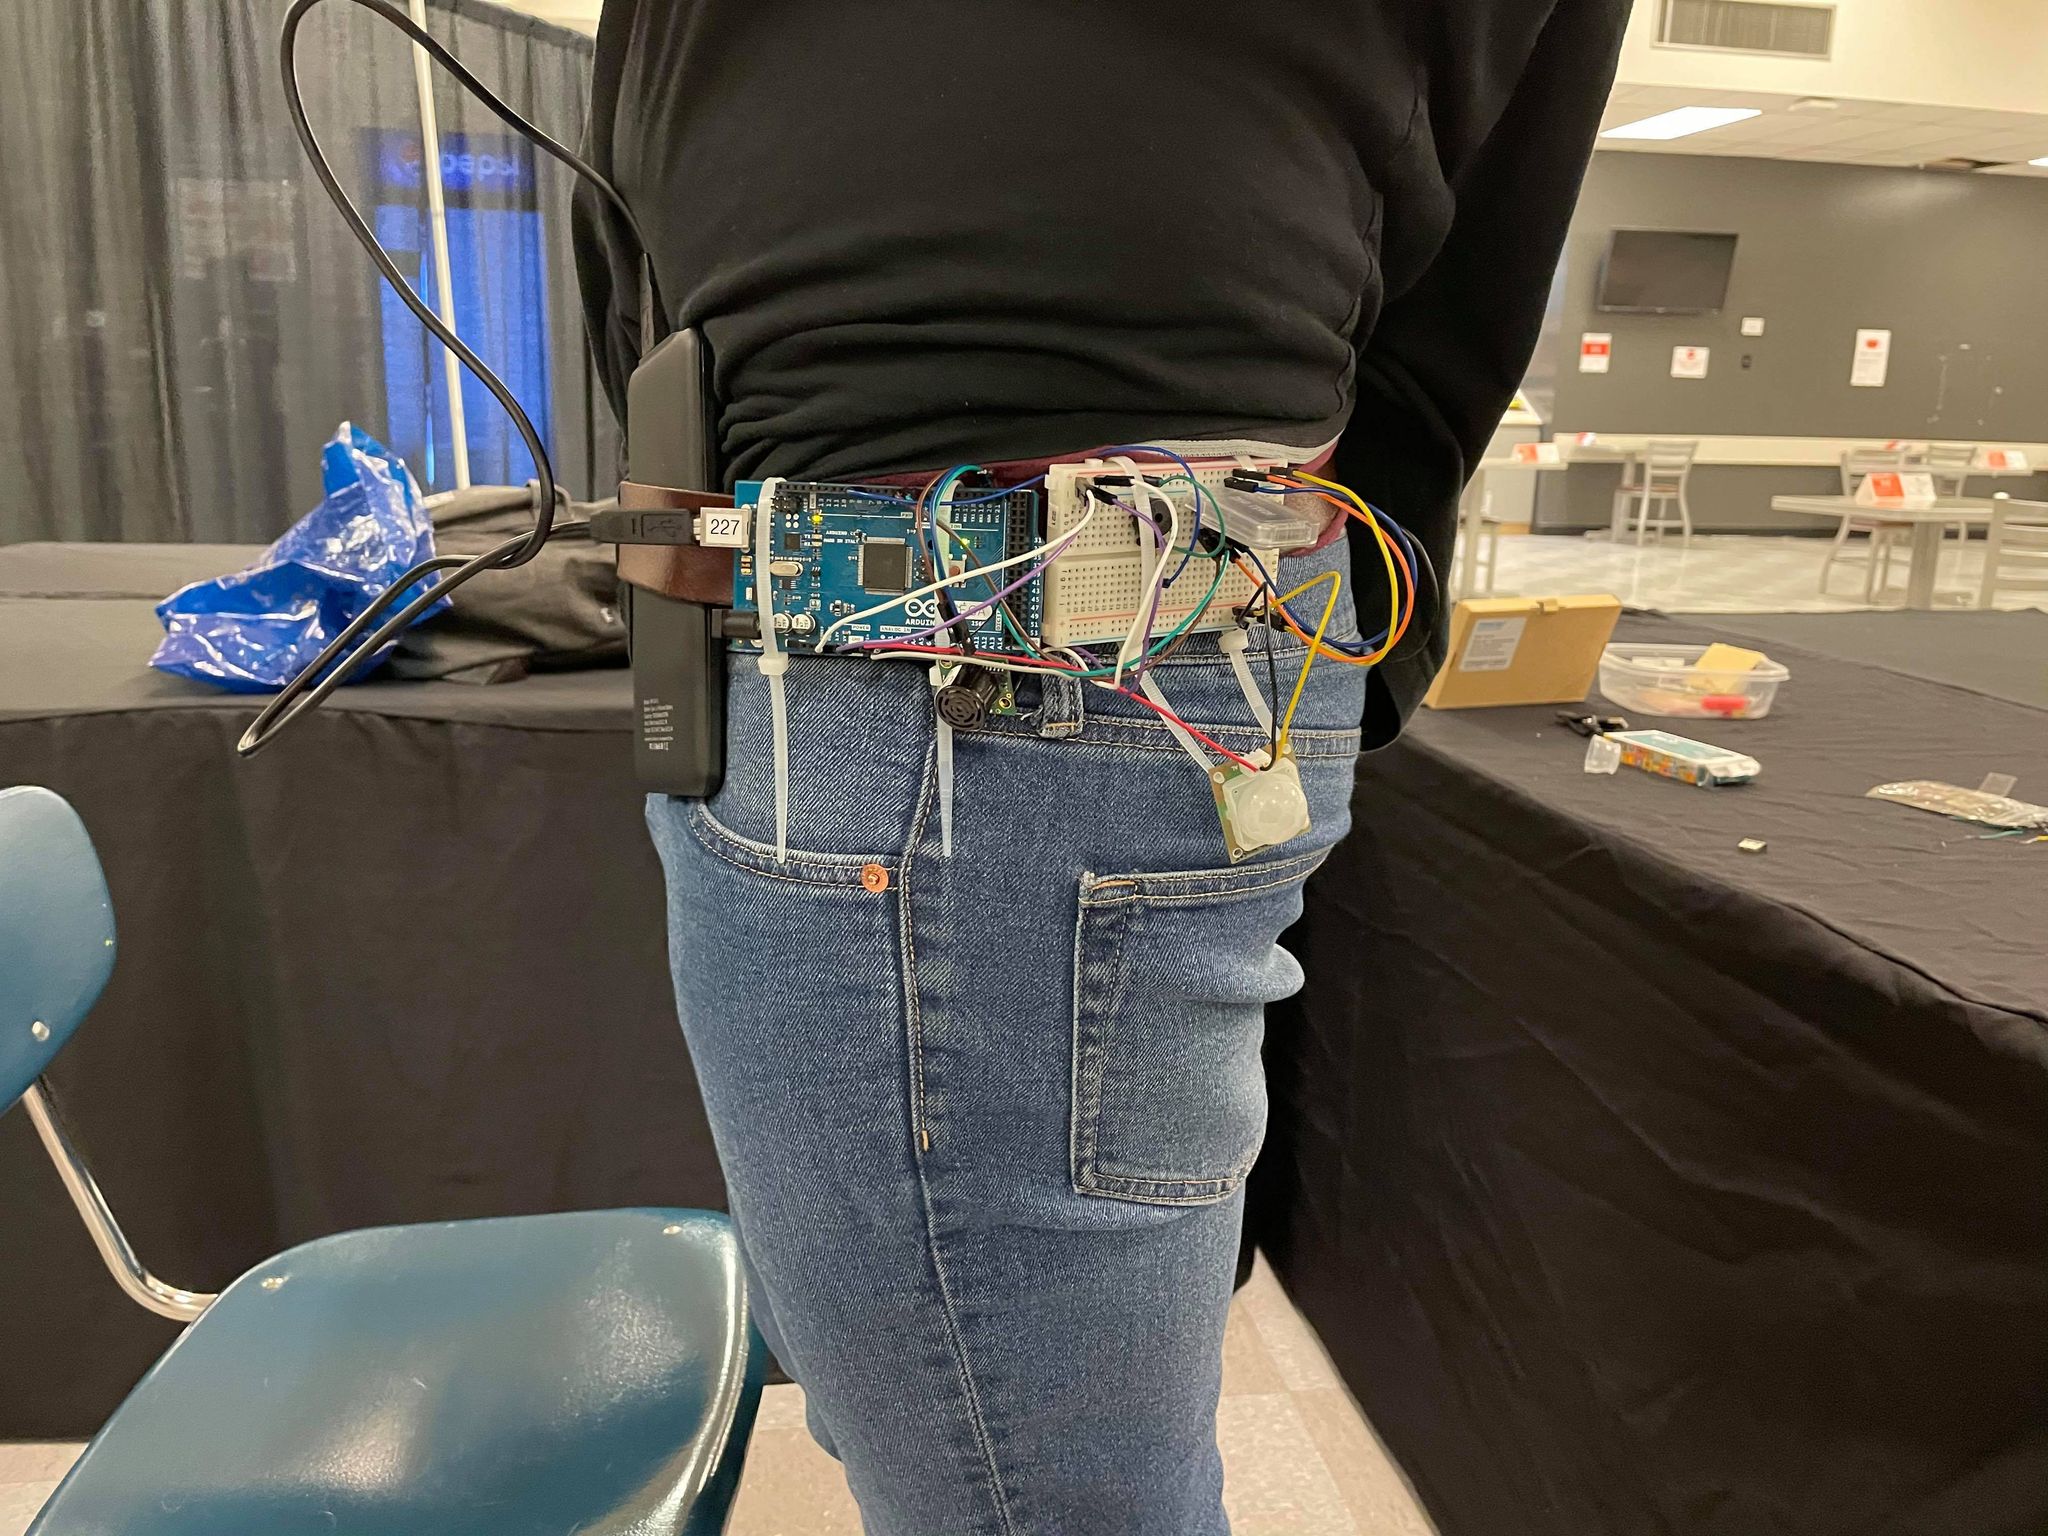
The Anti-Covid Belt is an engineering project developed in my time at Langara college with the purpose of providing an additional layer of protection against contracting the COVID-19 virus. The belt incorporates proximity sensors strategically placed around the user's waist to offer 360-degree coverage and trigger an alarm when someone breaches their personal space within a range of 6 feet or approximately 2 meters.
The main components of the Anti-Covid Belt include an Arduino Mega 2550 for processing data and controlling output, a breadboard for building the electrical circuit, a power bank for supplying power, ultrasonic sensors for measuring distances, a PIR sensor for detecting motion, a piezo buzzer for triggering alerts, and an HC-05 Bluetooth module for enabling dual-way communication with the user and controlling the sensors and buzzer.
Project Gallery:
